Skip to content

UV PRINTHEAD TOPOLOGY & KINEMATICS
Architectural Engineering Analysis for Industrial Flatbed Systems
Optimizing Volumetric Throughput via Multi-Row Staggered Arrays
In industrial UV flatbed inkjet engines, printhead layout determines spatial registration accuracy, jetting speed, and single-pass fluid layering. Staggering printheads across offset scan coordinates dramatically expands the active printing swath width, decouples functional liquid channels, and allows inline UV LED pinning between functional applications.
1. Printhead Array Topologies & Mechanics
Comparing architectural tradeoffs between Inline, Angled (Canted), and Multi-Row Staggered nozzle configurations.
Printhead configuration dictates the effective physical swath width per scan pass ($W_{\text{swath}}$) and the native dot density along the cross-scan Y-axis. While inline arrangements offer mechanical simplicity and compact carriage envelopes, they cap output at the active length of a single head ($L$). Angled arrays increase spatial dots-per-inch by slanting nozzle plates at angle $\theta$, but compress physical swath coverage ($L \cdot \cos\theta$). Staggered matrix topologies multiply active physical swath width linearly with head count, allowing high-speed multi-fluid deposition.
📊 Performance Index Across Topologies
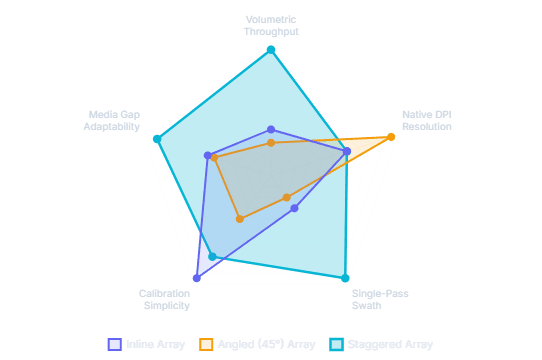
Key Takeaway: Staggered arrays provide the highest overall throughput and operational versatility for multi-fluid applications, sacrificing minimal calibration ease which is mitigated by automated optical CCD correction.
Inline Configuration
1.0x SpeedPrintheads are aligned sequentially along the secondary axis. All heads traverse identical physical paths.
Angled / Canted Configuration
0.7x SpeedPrintheads are rotated by tilt angle $\theta$. Reduces physical inter-nozzle distance to boost native Y-axis spatial DPI.
Staggered Multi-Row Array
3.5x SpeedPrintheads are offset in a stepped matrix along X and Y axes with precise nozzle overlap zones ($O_j$).
2. Mathematical Foundations & Resolution Scaling
Quantitative modeling of native DPI expansion versus effective swath width reduction under canted and staggered setups.
The mathematical trade-off inherent in angled printhead configurations is governed by trigonometric reduction of the nozzle pitch. As the tilt angle $\theta$ increases from $0^\circ$ to $60^\circ$, the effective nozzle pitch compresses by $\cos\theta$, yielding higher localized dot resolution at the direct expense of physical swath height. Staggered configurations bypass this swath loss by stepping multiple heads orthogonally.
📐 Tilt Angle $(\theta)$ Impact on DPI & Swath Width

Mathematical Insight: Rotating a head to $60^\circ$ doubles the native vertical DPI ($200\%$), but cuts single-pass vertical coverage height to exactly $50\%$ of nominal head length.
Where $P_{\text{native}}$ represents native nozzle pitch in millimeters and $\theta$ is the physical tilt angle relative to the cross-scan axis.
Where $N$ is total active heads along feed axis, $L$ is physical active nozzle length, and $O$ is required stitch overlap zone height.
3. Fluid Kinematics & Droplet Trajectory Dynamics
Analyzing aerodynamic drag, carriage speed vector components, and horizontal droplet drift ($\Delta X_{\text{drift}}$).
As carriage travel speed ($v_{\text{carriage}}$) and nozzle throw distance ($Z_{\text{gap}}$) increase, droplets ejected at initial velocity $v_{\text{droplet}}$ experience lateral velocity vectors and atmospheric turbulence drag. Wide staggered carriage assemblies generate localized micro-turbulences beneath trailing edges, requiring active fire-timing delays in RIP electronics to prevent edge distortion on textured or high-gap media.
🧪 Droplet Flight Dynamics Equation
Horizontal drift displacement ($\Delta X_{\text{drift}}$) scales linearly with throw distance ($Z_{\text{gap}}$) and carriage velocity ($v_{\text{carriage}}$), while aerodynamic drag ($a_{\text{air}}$) creates quadratic deceleration on trailing satellite droplets.
Industrial printheads engineered for high-gap jetting (e.g., Toshiba CF3R) utilize boosted piezoelectric drive voltage waveforms to elevate initial drop momentum ($v_{\text{droplet}} > 9.5\text{ m/s}$), suppressing satellite drop dispersion across elevated surface variations up to $5.0\text{ mm}$.
📉 Horizontal Droplet Drift ($\Delta X_{\text{drift}}$) vs Throw Distance ($Z_{\text{gap}}$)

Kinematic Analysis: Elevating throw gap from $1.0\text{ mm}$ to $4.0\text{ mm}$ at $1.6\text{ m/s}$ carriage speed increases horizontal drop impact drift from $26.7\ \mu\text{m}$ to $120.3\ \mu\text{m}$, demanding precise sub-pixel micro-delay encoder compensation.
4. Sequential Photopolymerization & UV LED Pinning Kinetics
Multi-stage curing mechanics, intermediate pinning radiation, and cross-linking energy density distribution.
In multi-row staggered UV arrays, functional fluids are deposited in spatially discrete rows during a single traverse stroke. Intermediate low-dosage UV LED pinning lamps ($10 – 50\text{ mJ/cm}^2$) follow each functional row to partially gel droplets ($10 – 20\%$ polymerization), freezing dot gain and preventing inter-ink bleeding. Final full cross-linking ($200 – 500\text{ mJ/cm}^2$) is executed by trailing high-intensity curing bars.
Adhesion Primer or high-opacity opaque White ink deposited onto raw substrate.
Low UV dose ($10 – 50\text{ mJ/cm}^2$) immobilizes white drops, freezing dot gain boundary.
Process color inks jetted directly onto pinned white base. Zero bleeding or mottling.
High UV dose ($200 – 500\text{ mJ/cm}^2$) drives full cross-linking across all composite layers.
⚡ UV Energy Dosage & Polymerization Level by Stage

☀️ Radiometric Energy Balance Equation
Radiant energy dosage ($E_{\text{UV}}$, $\text{J/cm}^2$) is inversely proportional to carriage speed ($v_{\text{carriage}}$). Increasing carriage speed to leverage staggered swath width requires dynamic pulse-width modulation (PWM) scaling of peak lamp irradiance ($I_{\text{lamp}}$).
Pinning prevents full exothermic cross-linking until all liquid layers are deposited, shielding heat-sensitive substrates (thin PVC films, acrylics) from thermal warping during high-speed production runs.
5. Operational Economics & TCO Dashboard
Comparing enterprise productivity metrics, maintenance protocols, and capital return on investment.
While staggered arrays increase initial hardware component count and carriage mass, the resulting multi-layer single-pass capability transforms operational cost structures. By eliminating media recoil passes, cutting calibration cycles via automated optical vision sensors, and multiplying square-meter-per-hour output, enterprise operators achieve rapid ROI payback.
Production Rate
m²/hr OutputStaggered architecture enables concurrent 3-layer printing without linear substrate recoil delays.
Daily Calibration Time
Operator MinutesIntegrated carriage CCD sensors scan target test swatches to calculate auto micro-delay timing adjustments.
Substrate Range
Media Adaptability- ✓ Standard Acrylic, Glass & Timber
- ✓ Textured & Corrugated Packaging
- ✓ Deep Recessed / Curved Objects (<5mm)
- ✓ Flexible PVC & Heat-Sensitive Foil
High-gap jetting paired with intermediate pinning unlocks diverse industrial application profiles.